
What PAR Actually Measures
PAR stands for photosynthetically active radiation — the 400 to 700 nanometer band of light plants use to drive photosynthesis. Not lumens. Not lux. Not "brightness" as your eye perceives it. Those are human-vision metrics, and plants don't see light the way you do.
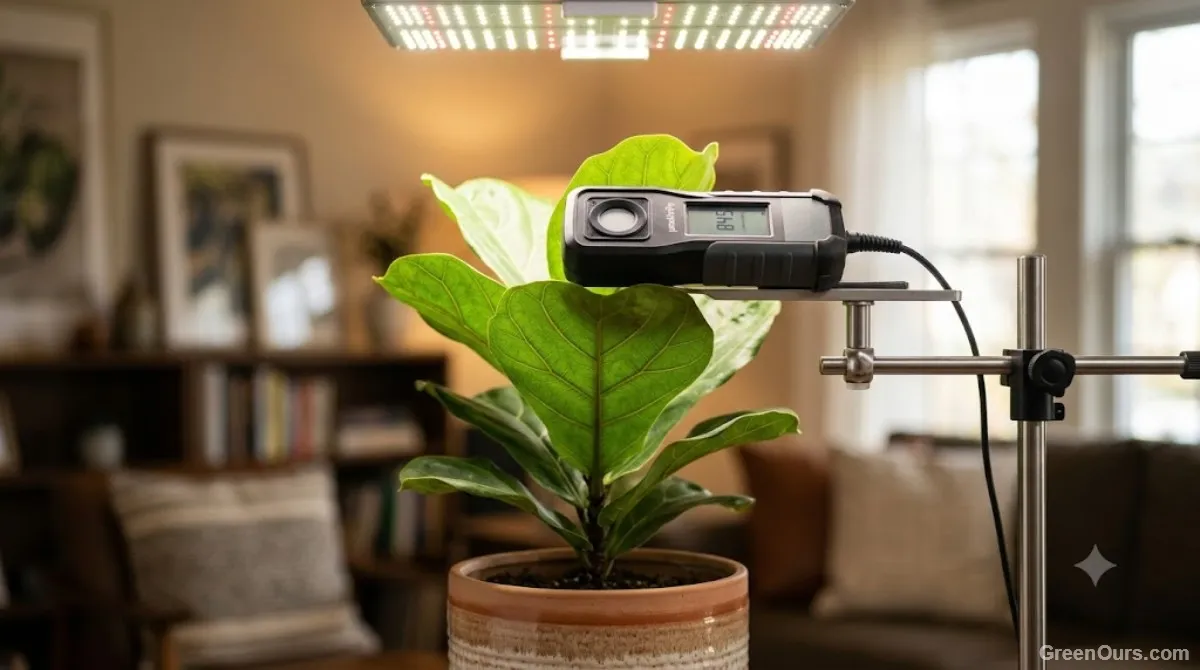
A PAR meter reports PPFD, photosynthetic photon flux density, in micromoles per square meter per second (µmol/m²/s). That number tells you how many usable light photons land on a specific spot of leaf surface, every second. It's the closest direct measurement of what actually fuels growth, and it's the figure most grow-light manufacturers use when they publish coverage charts.
Lux meters and most phone apps measure something different: how bright light appears to the human eye. Human vision peaks in sensitivity around 555nm, in the green-yellow range. Plants use red and blue wavelengths most efficiently. A light source can read high in lux and low in PPFD, or the reverse — which is exactly why the two numbers routinely disagree.
How Light Meter Apps Work (And Where They Break Down)
Smartphone light meter apps pull data from your phone's ambient light sensor or front camera. That sensor was built to adjust screen brightness and auto-exposure for photos. It was never calibrated to isolate the 400 to 700nm PAR band, and no software update changes what the hardware physically detects.
The Sensor Problem
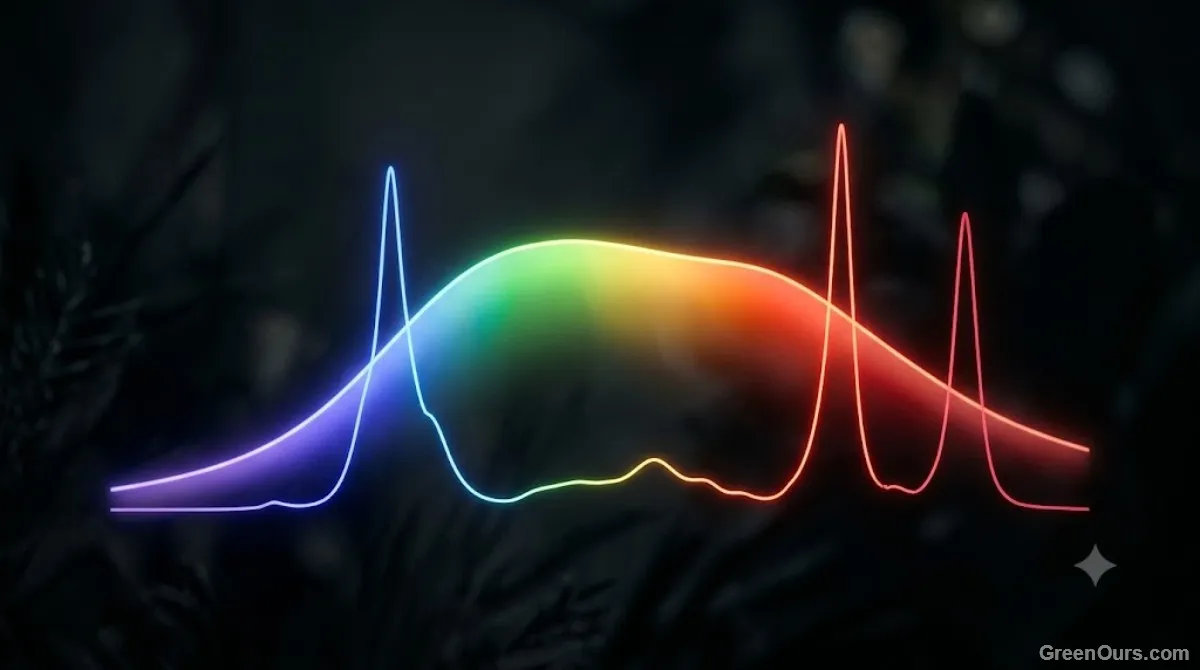
Phone sensors are tuned to mimic human vision, weighted heavily toward green wavelengths. Under LED grow lights, which often spike hard in blue and red with a dip in green, that mismatch produces readings that can run 30% to 50% off a calibrated quantum sensor under identical conditions.
The Spectrum Problem
Grow lights don't emit a flat spectrum. Full-spectrum LEDs, HPS bulbs, and fluorescent tubes each carry different peaks and troughs. A lux-based app can't distinguish between a fixture rich in usable red-blue PAR and one that's simply bright to the human eye. Two fixtures reading identically in an app can deliver very different photosynthetic output to the same plant.
If two different apps give you readings that differ by more than 15% under the same light source, neither number is reliable. Treat app output as a rough trend indicator, not an absolute value you can plan around.
Dedicated PAR Meters: What You're Paying For
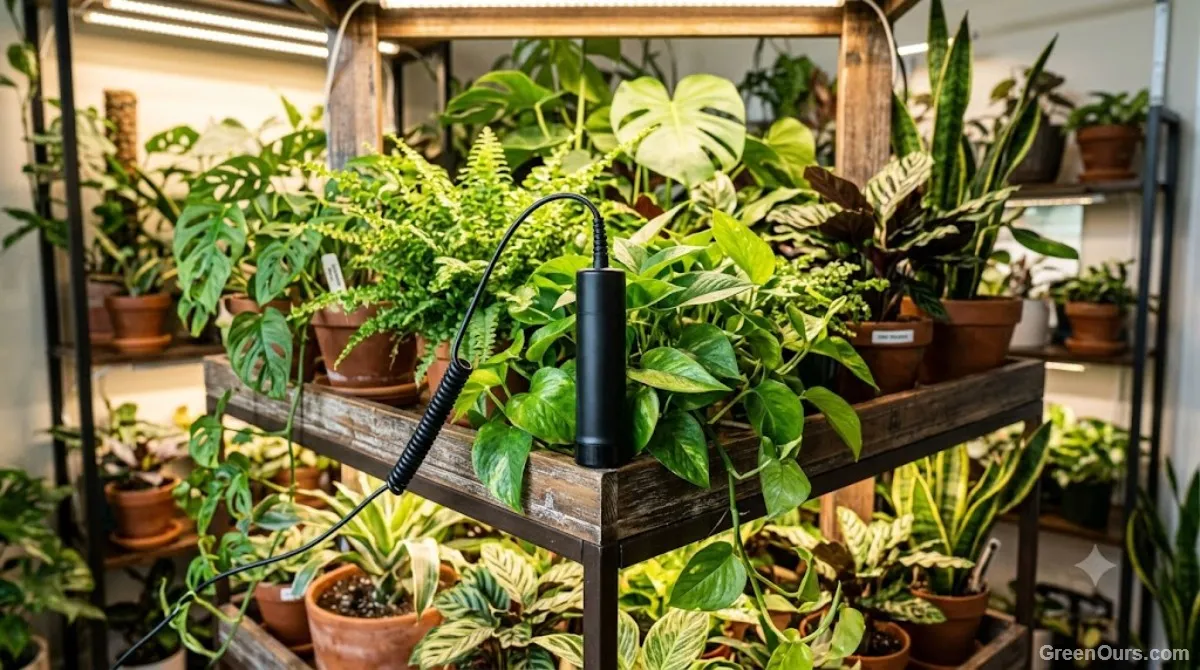
A quantum PAR meter uses a calibrated silicon photodiode with a filter tuned specifically to the 400 to 700nm range. Entry-level models start around $150. Mid-range units with data-logging run $250 to $400. Professional-grade meters used in commercial greenhouses exceed $600.
That cost buys three things an app can't replicate: sensor calibration traceable to a reference standard, a cosine-corrected head that reads light accurately from any angle rather than only straight on, and a spectral response built around actual photosynthetic absorption instead of human vision.
Accuracy on a calibrated PAR meter typically lands within 5% of true PPFD. That precision matters most when you're pushing plants near their light saturation point, where a 20% overestimate can mean bleaching or light stress you won't recognize until the damage is already visible on the leaves.
Head-to-Head: Accuracy in Real Grow Scenarios
Here's a representative example of how far apart these readings can land: under a standard 100-watt LED panel measured at 12 inches, a calibrated PAR meter typically reads somewhere around 600 µmol/m²/s, while different light meter apps under that same fixture can return anywhere from roughly 30% below to 30% above that figure once their built-in PAR conversion kicks in. That's still a meaningful spread from a single fixture, and it lines up with the sensor and spectrum problems described earlier.
That gap is the difference between recommending a low-light snake plant setup and a high-light succulent shelf under the same panel. Rely on an app's number to plan supplemental lighting, and you'll either underlight plants for months or scorch leaves you assumed were safely positioned.
Under natural window light, the gap narrows. Daylight has a broader, more even spectrum, so app-based estimates land closer to true PPFD, often within 15% to 20%. Apps perform best in the one scenario where growers need them least: bright natural light, where visual cues already tell you the plant is getting enough.
Who Actually Needs a PAR Meter
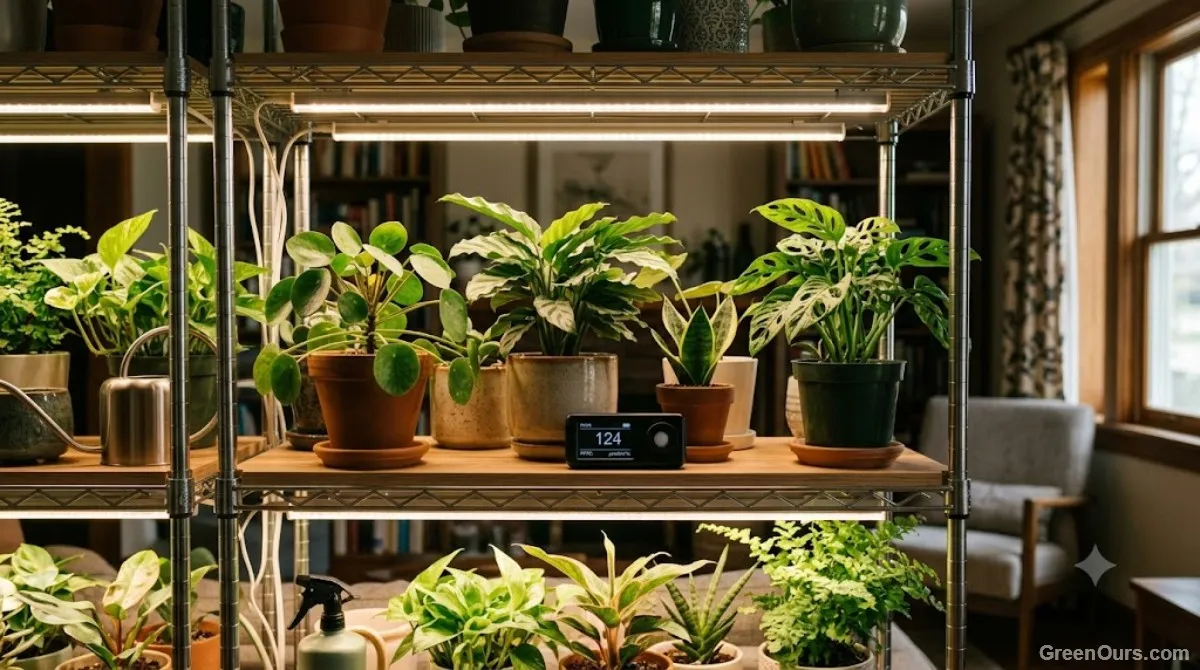
The PAR meter vs light meter app decision really comes down to how much precision your setup demands. Skip the dedicated meter if you're growing three or four low-light houseplants near a window. Leaf color, stretch, and growth rate tell you what you need to know. A free light meter app can confirm whether a spot is low, medium, or bright light, and that's all the resolution the decision requires.
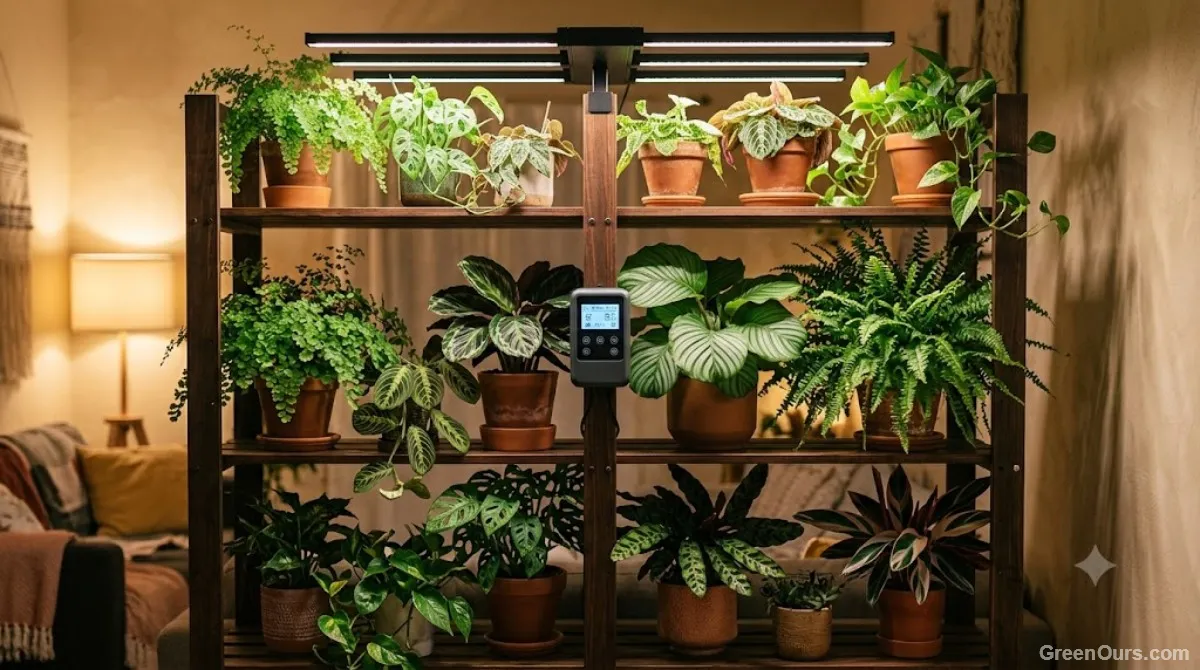
Buy a PAR meter if you're running a multi-tier grow rack, dialing in supplemental lighting for fruiting or flowering plants, or troubleshooting inconsistent growth across a shelf lit by one fixture. At that point, a 30% measurement error isn't a rounding issue. It's the reason half your plants are underperforming and you can't figure out why.
Growers scaling past six or seven light-dependent plants usually recoup the meter's cost within a season, in fewer plant losses and fewer wasted fixture purchases bought to "fix" a problem that was actually a measurement error the whole time. Some hydroponics stores also rent PAR meters by the day, which is worth checking before you commit to buying one outright. It's a low-risk way to see whether the more precise numbers actually change any decisions before you spend on a meter of your own.
Getting Reliable Readings From Either Tool
Take PAR readings at canopy height, not at the light fixture itself. Intensity drops sharply with distance, often 40% or more between 6 inches and 18 inches from an LED panel.
Measure at multiple points across the canopy, not just center. Edge readings on a grow shelf commonly run 25% to 35% lower than center readings under the same fixture, which explains uneven growth even when every plant sits under the "same" light.
If you're using an app, run the same measurement three times and average the results. Recalibrate your expectations against a known light source — direct overhead sun reads roughly 1,500 to 2,000 µmol/m²/s at midday — to gauge how far off your app's baseline really is.
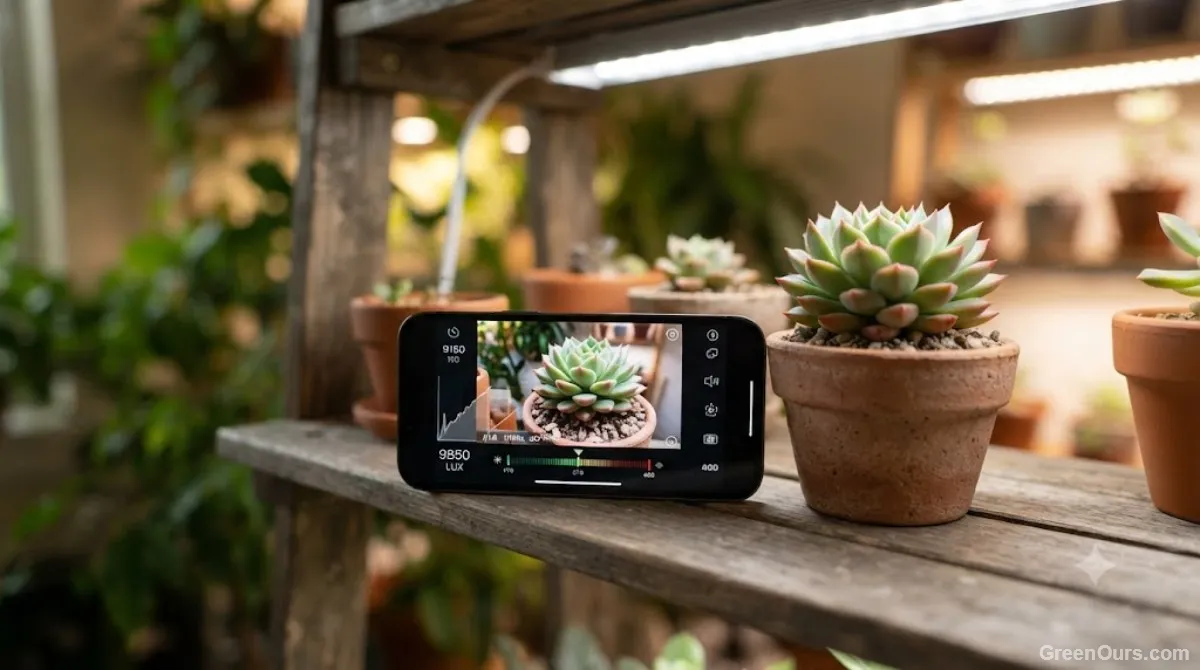
Match the tool to the stakes — a rough estimate for a windowsill, a real number once the setup gets complicated.
Match the tool to the stakes involved. A $12 app answers "is this spot bright enough" for a windowsill collection, and that's a fair trade for free. A $200 PAR meter answers exactly how many photons are hitting a given leaf — the question that matters once your setup gets complicated enough to need a real answer instead of an estimate.